

Weekly Market Commentary September 21, 2026
LPL Research analyzes S&P 500 margin expansion, assessing how much is structural versus cyclical and what that means for future earnings forecasts.

Last Edited by: LPL Research
Last Updated: September 21, 2026
What's Holding Up Record Margins?
Profit margins have historically been cyclical, but the recent performance of S&P 500 companies has many investors questioning whether this rule still stands. Structural changes in the composition of the index, and the higher margin profile that results from that change, suggest that a higher baseline margin is justified. However, we argue that some portions of current and future profit margins are either cyclical or temporary, yet are being capitalized as permanent in current analyst forecasts. Here, we analyze the historical trajectory of S&P 500 margins, estimate how much of the recent margin expansion is structural vs. cyclical/temporary, and provide tangible examples with industry case studies.
Margins are Mean-Reverting. Right?
For decades, operating margins (earnings before interest and taxes, or EBIT, divided by sales) behaved like a cyclical series. When margins rose well above trend, the forces of competition, input costs, capacity additions, and customer pushback eventually compressed profitability. As Jeremy Grantham, investor and co-founder of asset manager GMO, famously said, “Profit margins are probably the most mean-reverting series in finance, and if profit margins do not mean-revert, then something has gone badly wrong with capitalism.”
This has been a less reliable rule since the Global Financial Crisis (GFC), as S&P 500 operating margins did not revert to their historical average, but remained remarkably steady in what appeared to be a stepped-up new range from 2010 to 2019. The post-COVID-19 period has seen yet another step-change higher, and recent figures show an upward trend rather than a range. The current trailing-12-month operating margin is at a record high of approximately 16.5%, a level that several strategists thought to be a secular peak. Forward-looking bottom-up estimates sourced from Bloomberg suggest calendar year records will continue to be made in 2026 (19.8%), 2027 (22.1%), and 2028 (23.6%). While these out-year estimates may ultimately prove too optimistic and likely reflect “adjusted” rather than GAAP figures, analysts are clearly not anticipating a reversion to long-term or more recent averages. To put it mildly, current and forecasted margins appear stretched.
However, the simple chart glosses over the fact that the index has structurally changed over time. The S&P 500 has migrated away from capital-intensive cyclical businesses and toward companies with predictable recurring revenue and high incremental margins. So, has something gone badly wrong with capitalism? Or, does the mean-reversion argument need to be refined? We lean toward the latter and therefore do not expect today's S&P 500 operating margin to revert all the way back to the pre-2010 average without a significant change in the composition of the S&P 500. The risk is that investors mistake a higher baseline for a permanently rising one.
Technology Sector Mix: Is Intellectual Capital Still Capital-Light?
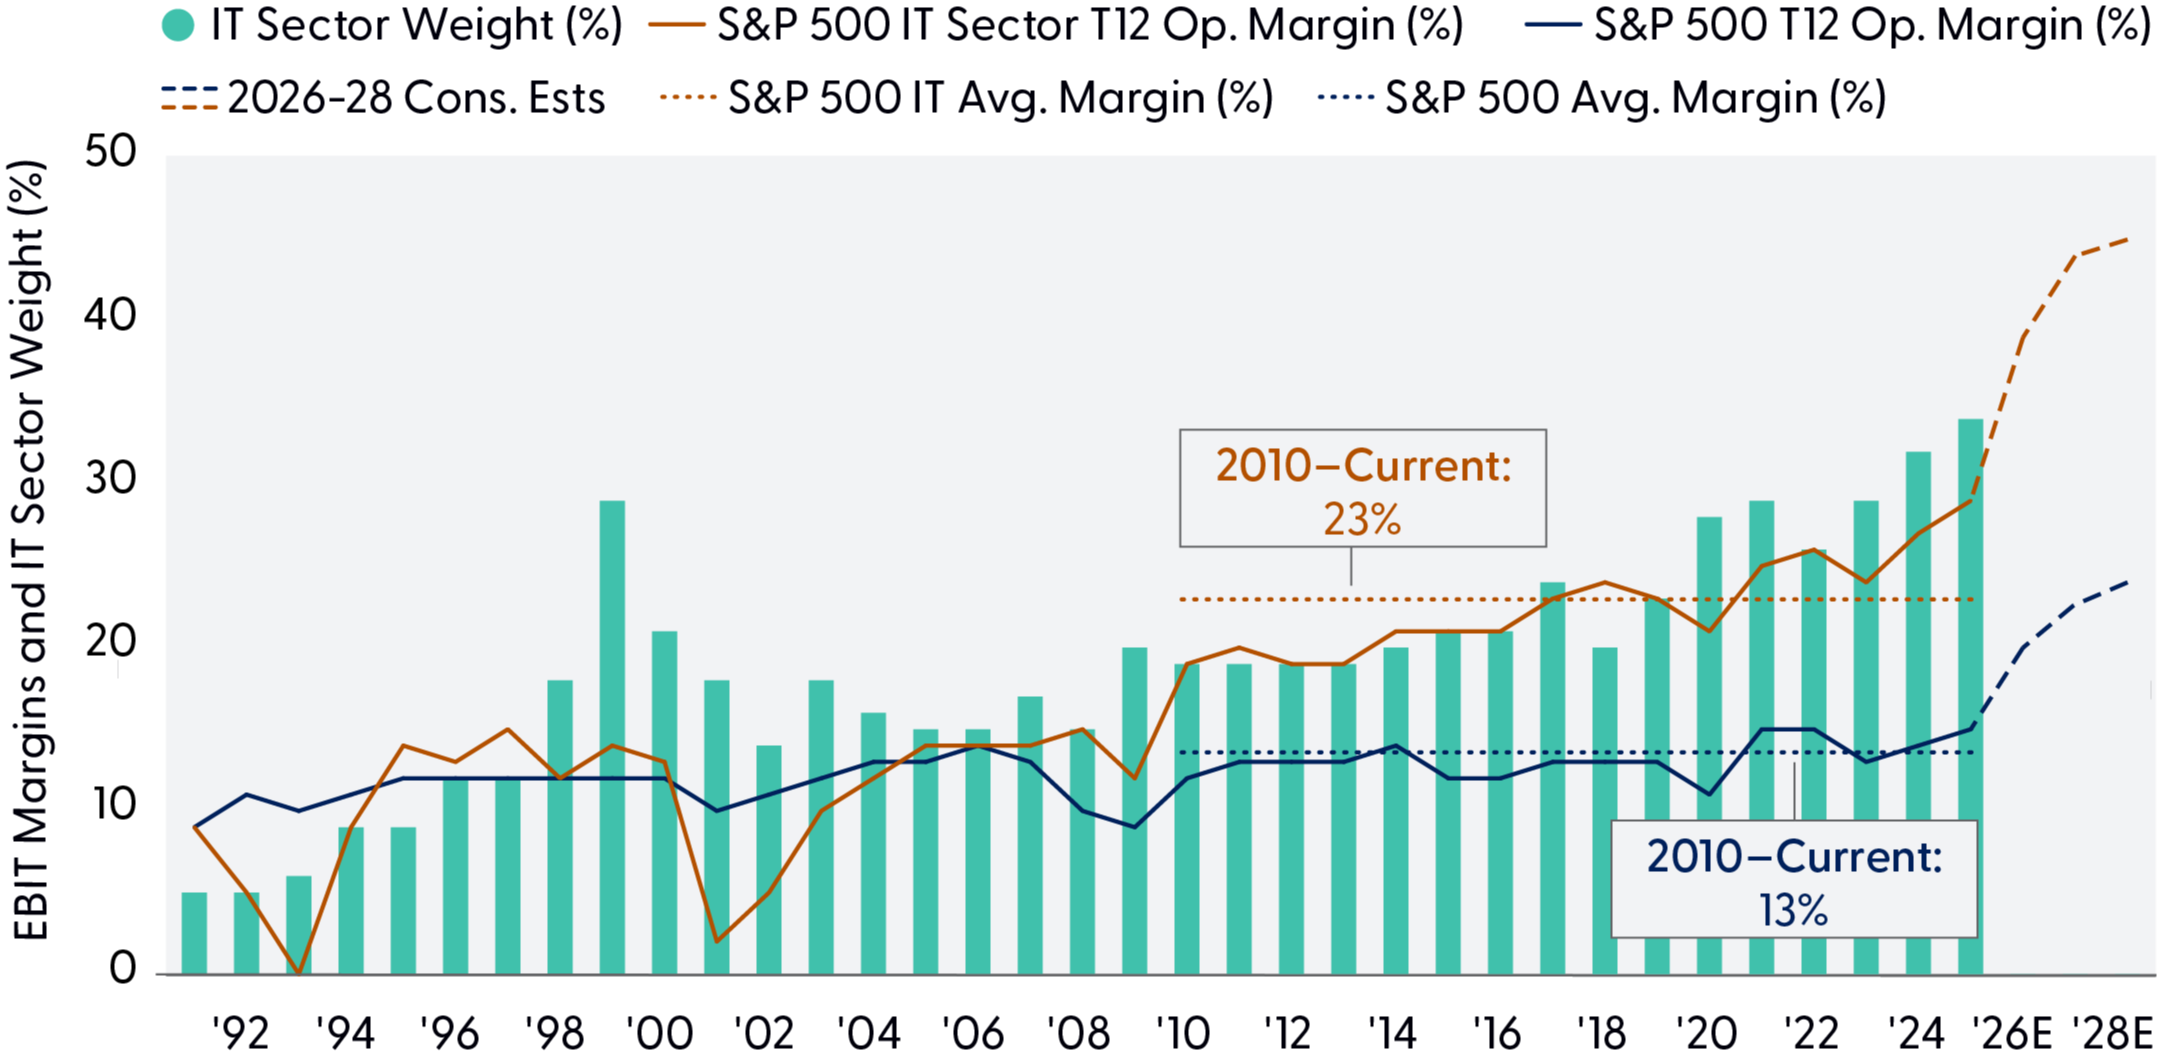
The biggest reason margins have defied historical gravity is the rising weight of the information technology (IT) sector and technology-adjacent businesses. IT now represents roughly 37% of the S&P 500. Add Alphabet Inc. (GOOG/L) and Meta Platforms (META) within communication services, plus Amazon.com (AMZN) within consumer discretionary, and the technology-linked index's weighting is roughly 48%.
Technology companies have historically had fundamentally lean business economics. The Al investment cycle complicates the story, however, as it is much more capital-intensive and “asset-heavy” than the sector's typical research & development focused expenditure. This leads investors to wonder whether the physical capital that is required to fuel the sector's “next big thing” growth bet will make index-level margins less durable.
Bulls argue that the return on investment will be great enough to drive incremental shareholder value. History is littered with successful executives committing ever more capital into exciting and innovative business opportunities, with only subpar returns to show for it. What we do know is that many of the underlying businesses that drove index level margins to new heights have fundamentally changed.
IT Sector Margins and Index Weight
Source: LPL Research, Bloomberg 09/15/26
Disclosures: All indexes are unmanaged an cannot be invested in direectly. Past performance is no guarantee of future results. Estimates may not materialize as predicted and are subject to change.
The “IT Sector Margins and Index Weight” chart tells the story of the two impacts the IT sector has had on the market writ large. The first impact, sector mix, is structural and argues against operating margins mean-reverting to the pre-2010 average. The second impact is the intra-sector effect of technology margins themselves being at record levels as many of the largest companies are undergoing a capital-intensive business transformation cyclicality hiding in plain sight.
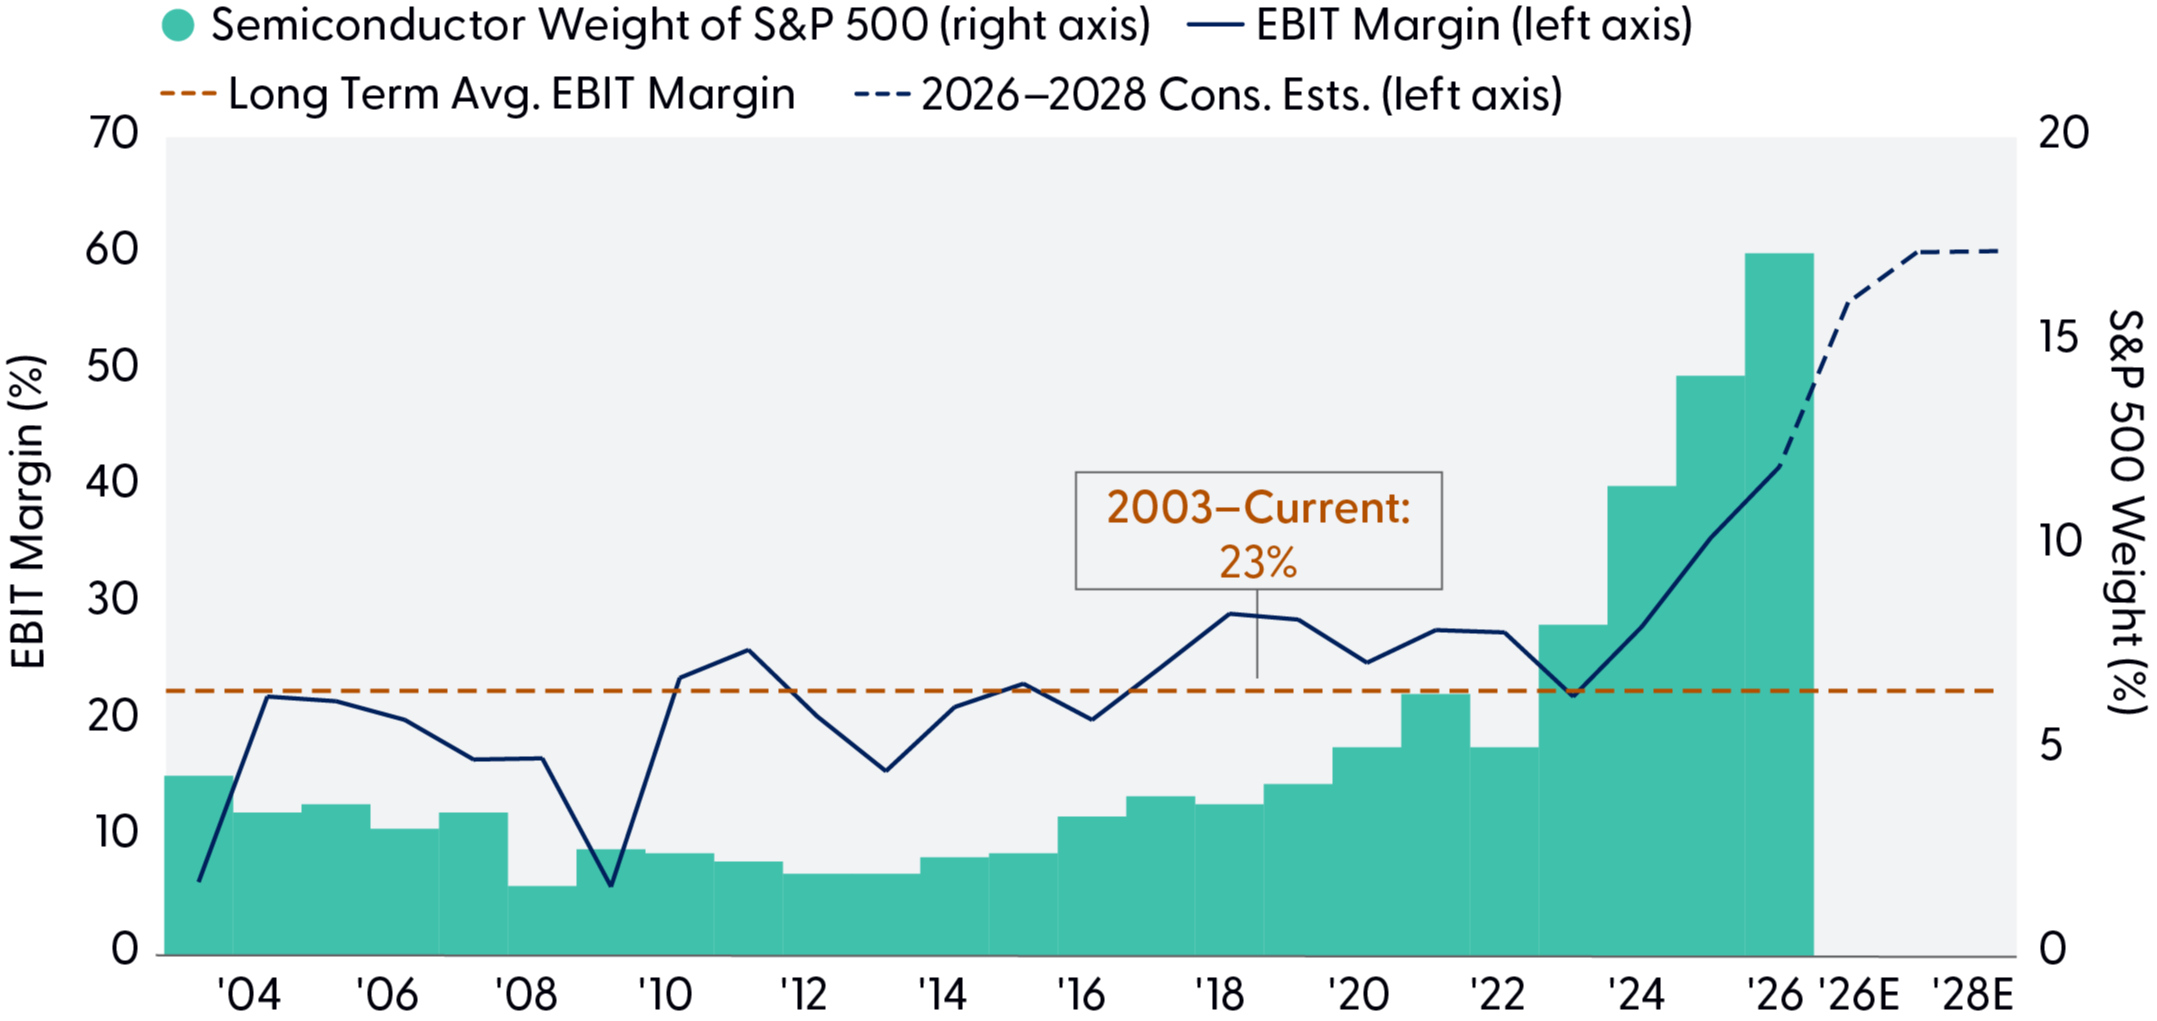
Beyond the shift in the capital intensity of previously “asset-light” IT platform and software businesses, we also highlight the massive influence the semiconductor industry now has on S&P 500 operating margins as further evidence that investors should not capitalize current margins into perpetuity. The semiconductor industry has long been the cyclical corner of the tech sector, with booms and busts that produce a very different through-cycle earnings trajectory. As the primary beneficiary of the Al investment boom, the semiconductor and semiconductor equipment industry group now makes up ~45% of the technology sector, and ~17% of the entire S&P 500. Additionally, the industry has seen margins expand to record highs in the current cycle, which by our estimates, has driven nearly half of the index-level margin expansion from 2019. To summarize: The now largest industry group, which has driven nearly half of S&P 500 margin expansion since 2019, is a cyclical industry with a history of capital-cycle booms and busts.
Semiconductor Margins at All-Time Highs and Have Driven ~48% of S&P 500 Margin Expansion
Source: LPL Research, Bloomberg 09/15/26
Semiconductor index = S&P 500 Semiconductors and Semiconductor Equipment Industry Group GICS 2 Index
Disclosures: All indexes are unmanaged and cannot be invested in directly. Past performance is no guarantee of future results. Estimates may not materialize as predicted and are subject to change.
Three Sources Driving Excess Margins
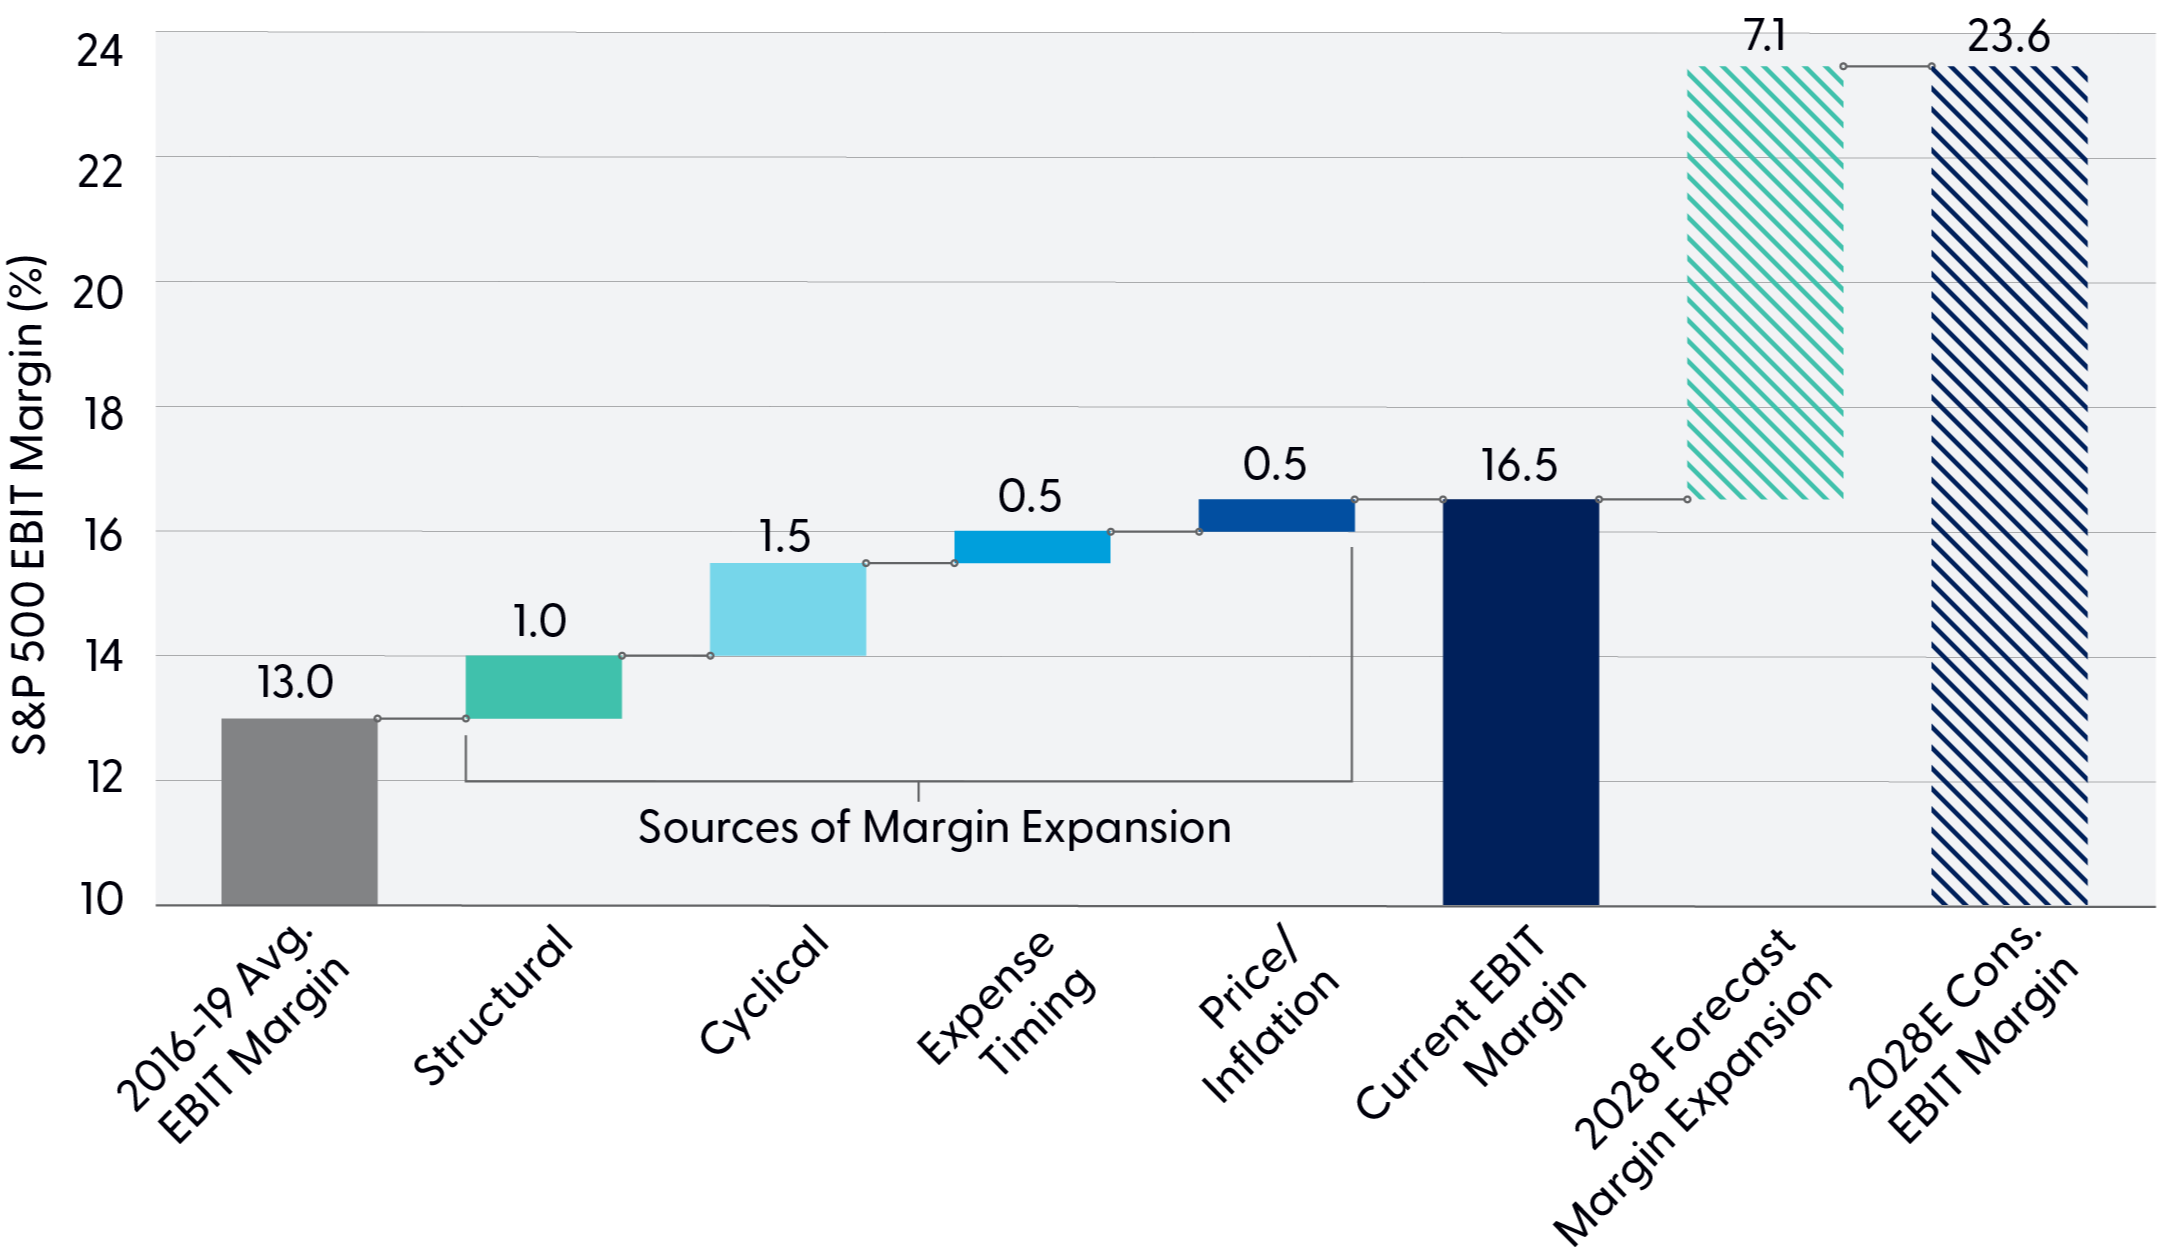
Today's record S&P 500 operating margins, when compared to a post-GFC/pre-COVID baseline, reflect the structural index composition effect previously outlined, plus three overlapping forces that we argue remain subject to the laws of gravity and are likely to reverse. We make a best-effort estimate of each factor below and plot their contributions in “Estimated Sources of S&P 500 Margin Growth Since the 2016-2019 Average.” This analysis is illustrative of our view of a normalized operating margin and is not part of LPL Research's index EPS estimates.
For this analysis, we use the 2016-2019 average S&P 500 index level operating margin of 13.0% as our baseline level and decompose the incremental contributions to the current trailing 12-month operating margin of 16.5%, a total margin expansion of ~3.5%.
First, the structural effect. Here, we make an estimate of how much of that structural impact persists in a current normalized operating margin range. We estimate ~1% of the ~3.5% margin uplift is attributable to this structural index composition effect.
Second, the cyclical effect. This is primarily driven by the Al trade, as discussed with the semiconductor industry's cyclicality and record margins, and is admittedly the most opaque, and hardest to quantify. Given the record margin contribution driven by scarcity economics in the semiconductor industry, alongside those same scarcity economics driving data center capacity additions from the hyperscalers, we are comfortable applying the lessons from capital cycle theory in our 1.5% margin contribution assumption. Further, when we think about contributors driving forward margin estimates, should they come to pass, we would place most of that potential ~7% expansion from current levels to 2028 into this cyclical bucket.
Third, a temporary, accounting-based impact. The hyperscalers' cash capital expenditures have not yet fully reflected on income statements where GAAP EBIT margins are derived, due to the delayed recognition of depreciation expenses and leases. Simply put, hyperscaler capital spending is running far ahead of current accounting expense recognition, and the size and scale of this investment cycle merit an estimate of the impact. Our estimate works out to ~0.5% contribution, which we believe is fair, given the Al investment cycle beneficiaries' large overall contribution to index-level margins.
Finally, inflationary price-led revenue growth. In the years following the pandemic and inflation shock, many companies were able to raise prices faster than unit volumes declined. The risk is that price-led revenue can look like durable operating leverage when it is really a temporary pricing umbrella. This final margin expansion bucket serves as our plug to get from our baseline estimate to the current margin level, and therefore represents a 0.5% contribution to margin expansion.
Estimated Sources of S&P 500 Margin Growth Since 2016-2019 Average
Source: LPL Research, Bloomberg 09/15/26
Disclosures: Past performance is no guarantee of future results. Estimates may not materialize as predicted and are subject to change. Indexes are unmanaged and cannot be invested into directly.
Unpacking Margins Across Select Industries
To stress-test whether today's elevated S&P 500 GAAP EBIT margins are structural or cyclical, we look across four industry case studies that each highlight a different margin mechanism. Taken together, these case studies suggest that the margin story is partially structural, partially cyclical, and partially a timing mismatch between investment and expense recognition.
Consumer Packaged Goods
Consumer packaged goods businesses in the consumer staples sector provide a clean case study in margin quality because the group's organic growth can be separated into price and volume. From 2010-2019, our CPG cohort generated average annual organic growth of 3.5%, with a reasonably balanced contribution from price (+2.0%) and volume (+1.4%), while GAAP EBIT margins averaged 17.1%. Recently, pricing has become the dominant growth driver as companies pushed through inflation-related increases, while volume turned negative. That pricing power helped protect profitability through the cost shock, and margins have remained elevated. Put simply, CPG margins have not reverted because price did the work volume used to do.
Airlines
Airlines are not directly accretive to S&P 500 operating margins in the current cycle. As a group, which we define as the big four domestic operators, Delta (DAL), United (UAL), American (AAL), and Southwest (LUV), operating margins have declined meaningfully from pre-pandemic levels. Importantly, utilization was largely unchanged, so the margin compression was not primarily a utilization problem. Unlike staples, where pricing more than protected margins through the inflation shock, airlines saw higher nominal fares absorbed by structural cost inflation in labor, maintenance, airport costs, and other non-fuel expenses. The takeaway is that relying on price alone can only go so far.
Commodity Producers
Commodity producers are the clearest example of why margin mean reversion remains relevant, even in a market where index-level margins may deserve a higher structural baseline. E&P's and miners are currently generating a GAAP EBIT margin well above the full-cycle average and far removed from the 2015-2016 bust. The current profitability is partially the product of a prior capital starvation cycle, and the group's post-bust margin growth was a price story and a capital discipline story.
For the S&P 500, this is not the dominant source of record margins as commodity producers represent only about a tenth of the EBIT-weighted margin contribution, but it is one of the more obviously cyclical pieces. Put simply, commodity producers have not yet repeated the last capex mistake, but the conditions that usually lead to that mistake (high margins, strong FCF, and investor confidence in “new discipline”) are increasingly in place.
The Al Trade
The Al trade is the most important margin story in the market, and it is also the most two-sided. For the hyperscalers, the bull case is that Al demand is real and growing and capital outlays will generate returns to justify the spend. The risk is timing. GAAP EBIT margins today do not yet fully reflect the future depreciation and lease expense associated with the current infrastructure build. The hyperscalers purchased approximately $609 billion of property and equipment in the four quarters through June 2026, against roughly $118 billion of reported depreciation. Capex is an immediate cash cost, while depreciation is a gradual accounting expense. If revenue ramps ahead of depreciation, margins can hold. If revenue lags, EBIT margins face a mechanical headwind. This makes GAAP EBIT an incomplete forward-looking measure. The market is effectively underwriting a future return on Al infrastructure before that return is fully visible in the income statement.
Semiconductors are the other side of the same Al margin coin. The industry is experiencing scarcity economics in leading-edge chips, advanced packaging, high-bandwidth memory, and Al networking. Recently delivered extraordinary margins from the likes of Taiwan Semiconductor (TSM) and NVIDIA (NVDA) attract extraordinary capital. Semiconductor equipment sales are expected to rise sharply in 2026, and the supply response is already underway across leading-edge capacity, packaging, and memory. The historical pattern remains: tight supply drives pricing and utilization; pricing and utilization drive margins; margins attract capex; capex eventually normalizes supply and compresses returns.
Conclusion
If we were to summarize everything in one sentence, it would be that margins are still mean-reverting, but the mean has moved. The S&P 500 has earned a higher structural operating margin than it did in prior cycles because the index is more technology-heavy, more intangible-heavy, and more exposed to businesses with high incremental margins.
But accepting a higher structural baseline is not the same as accepting today's record margins as permanent. Price-led revenue in the consumer and industrial sectors may fade as volume matters more. Commodity producers are experiencing strong margins after prior “bust”-led downcycles led to years of underinvestment, and the cycle will eventually attract capital yet again. Semiconductor and Al infrastructure margins reflect scarcity conditions that are already attracting new supply. Hyperscaler GAAP EBIT margins have not yet absorbed the full depreciation and lease burden of the current Al capex cycle.
The right framework for investors is not “margins must revert” versus “margins have permanently broken higher.” It is to decompose the margin level into structural, cyclical, and deferred components. The structural component earns a higher multiple, the cyclical component does not, and the deferred component requires scrutiny.
Asset Allocation Insights
LPL's Strategic and Tactical Asset Allocation Committee (STAAC) maintains its recommendation for a tactical equity overweight and fixed income underweight. We believe an improving macro backdrop and sustained Al-driven earnings growth will continue to support the broader equity market through the remainder of 2026. The Committee recently shifted the implementation of the equity overweight from low-volatility strategies to a quality-factor tilt to enable greater upside participation and allow portfolios to diversify between the Al theme and potential rotation beneficiaries. We continue to favor the industrials and energy sectors, providing a modest tilt toward value-style industry groups. Industrial companies offer a lower beta way to benefit from the Al infrastructure buildout, while an energy overweight offers a desirable hedge against potential additional disruptions to global energy production and shipping.
Tom Shipp, CFA, Head of Equity Research, LPL Financial
Tucker Beale, Sr. Equity Research Analyst, LPL Financial
Important Disclosures
This material is for general information only and is not intended to provide specific advice or recommendations for any individual. There is no assurance that the views or strategies discussed are suitable for all investors or will yield positive outcomes. Investing involves risks including possible loss of principal. Any economic forecasts set forth may not develop as predicted and are subject to change.
References to markets, asset classes, and sectors are generally regarding the corresponding market index. Indexes are unmanaged statistical composites and cannot be invested into directly. Index performance is not indicative of the performance of any investment and do not reflect fees, expenses, or sales charges. All performance referenced is historical and is no guarantee of future results.
Any company names noted herein are for educational purposes only and not an indication of trading intent or a solicitation of their products or services. LPL Financial doesn't provide research on individual equities.
All information is believed to be from reliable sources; however, LPL Financial makes no representation as to its completeness or accuracy.
All investing involves risk, including possible loss of principal.
Important Scenario Analysis Disclosure: The analyses, scenarios, projections, and estimated returns discussed herein are hypothetical, are based on assumptions and estimates, and are provided solely for illustrative and educational purposes. The hypothetical “average hyperscaler” referenced in this report does not represent an actual company, portfolio, account, or investment product. Results shown are not forecasts or guarantees of future performance and are not intended to predict or project the performance of any specific security, company, sector, or market. Actual results may differ materially due to changes in economic conditions, competitive dynamics, technology adoption, capital spending, utilization rates, pricing, regulation, operating costs, and other factors.
The hypothetical results shown were not achieved by any actual investment strategy, account, or client and should not be viewed as indicative of actual investment results.
US Treasuries may be considered “safe haven” investments but do carry some degree of risk including interest rate, credit, and market risk. Bonds are subject to market and interest rate risk if sold prior to maturity. Bond values will decline as interest rates rise and bonds are subject to availability and change in price.
The Standard & Poor's 500 Index (S&P500) is a capitalization-weighted index of 500 stocks designed to measure performance of the broad domestic economy through changes in the aggregate market value of 500 stocks representing all major industries.
The PE ratio (price-to-earnings ratio) is a measure of the price paid for a share relative to the annual net income or profit earned by the firm per share. It is a financial ratio used for valuation: a higher PE ratio means that investors are paying more for each unit of net income, so the stock is more expensive compared to one with lower PE ratio.
Earnings per share (EPS) is the portion of a company's profit allocated to each outstanding share of common stock. EPS serves as an indicator of a company's profitability. Earnings per share is generally considered to be the single most important variable in determining a share's price. It is also a major component used to calculate the price-to-earnings valuation ratio.
All index data from FactSet or Bloomberg.
This research material has been prepared by LPL Financial LLC.
Not Insured by FDIC/NCUA or Any Other Government Agency | Not Bank/Credit Union Guaranteed | Not Bank/Credit Union Deposits or Obligations | May Lose Value
RES-0007122-0526 Tracking #1177698 | #1177706 (Exp. 09/27)